BLOG
Are you communicating your story with the right data?
Authored by Alexander Homer - Product Manager & Katie Frame - Principal Product Marketing Manager
In today’s business environment, there is so much data to be managed and many different ways that we need to communicate with our customers and colleagues. At the end of the day, you need to convey information with confidence and be able to explain the “why” behind the data. That’s where a robust business analytics tool can help you parse, manage and report on the information that you need to communicate.
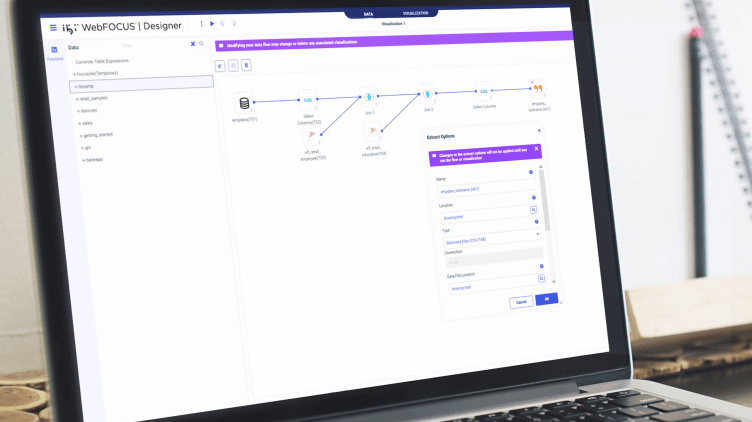
Let’s say you need to create a report that brings together information from several different master files that are not typically combined in your business analytics software. You need to collect, analyze and manipulate the data in order to bring together the elements that you are reporting on and generate interesting visualizations to support your findings. Previously, to do that, you would work with someone in IT to get the data and then create each visualization from a series of new files. With the WebFOCUS series 9 releases, we are excited to bring new capabilities in designing and reporting that let you create custom reports without having to recode or program your reports.
Using the Designer tool, you can leverage HOLD files to create your own views of the data that you need. Create a HOLD file to bring data from any master file together in ways that you want to see and use it. You can manipulate the data, create calculations and report on it in the format that you require. Because you can build it as you need it - with no coding, no database knowledge, no need to recreate connections - it means you can customize it on the fly and adjust as needed. And, you can save the HOLD files for re-use to generate your own custom views at any point.
As an example, let’s say you need to provide insight into the sales distribution process. To do this, you need access to master files for both shipments and sales in order to bring together the data that creates the entire picture. In its raw form, the data is coming from different sources and organized differently. With a HOLD file, you can join the two to create custom reports that blend and combine all the data to show how sales are tracking against shipments, costs associated with distribution and future predictions to optimize your processes. This custom view, with calculations and other data transformations, can be saved so that you can repeat the analysis at a later time. You can deliver the information to the right audience with the right data to support your recommendations.
Learn more about the ways that you can use WebFOCUS Designer to strengthen your access to data and provide the maximum flexibility and self-service capabilities you need to use and understand your data.