BLOG
Give geospatial context to your data
Authored by Alexander Homer, ibi Product Manager
Remember back before we had smartphones and high-speed Internet, how hard it was to get directions to an unfamiliar location? Nowadays, maps are always available on-demand and even in the palm of our hand, and we use them daily, whether it’s checking traffic, finding a new restaurant, or getting directions to that restaurant. But maps aren’t just useful in our daily life: you’ve probably seen lots of cool and eye-catching infographics that use maps to give a spatial context to large volumes of data. With WebFOCUS’ geoanalytics capabilities, you can do the same thing with your own data.
For example, you can review sales data for different store locations to identify which areas are most profitable and compare that with demographic information to identify areas with high potential for growth and expansion. You could also create maps with streaming data to track shipment status to various locations. You can even connect these maps with external content using drill-downs to dig deeper into your geospatial data.
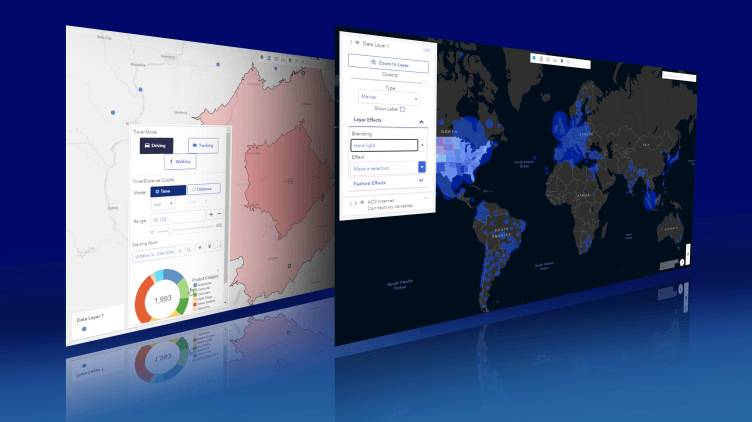
Creating a basic map with WebFOCUS is made easy with a specialized multi-layer map tool in WebFOCUS Designer. You can plot geographic locations from your data sources on a map as either geographic areas in a choropleth map or as points in a bubble map. You can create multiple map layers stratified on top of each other to show even more information, and you can even access demographic layers available on Esri ArcGIS. WebFOCUS includes a default set of demographic layers, and automatically recognizes standard geolocation fields, like countries, states, or cities, to make it easy to start on your geoanalytics journey. When you run a multi-layer map, the WebFOCUS map interface provides numerous options out of the box, including clustering, heatmaps, feature effect filtering, and more.
Meanwhile, for users familiar with GIS and geoanalytics features, WebFOCUS provides a tremendous level of flexibility and customizability. You can use your own shapefiles as a custom geographic role, allowing you to map your data even if it doesn’t fit the typical classifications, and you can use an image or SVG as a custom icon in a bubble map for even more flexibility in your styling options. Furthermore, WebFOCUS’ Esri integration means you can connect an Esri ArcGIS account to your WebFOCUS environment to access additional demographic layers, including streaming layers, and leverage Esri GIS capabilities to perform geocoding, drive-range analysis, and more using functions and widgets built into WebFOCUS. Finally, you can tie your maps back into the rest of your content by building pages and dashboards with dynamic drill-downs, allowing you to select values from a map that you want to see analyzed in your charts or reports.
All in all, WebFOCUS provides a broad set of tools with which to perform geoanalytics regardless of your level of experience. Whether you’re building your first map using just the data you have in WebFOCUS, or utilizing external layers, shapefiles, and icons, WebFOCUS gives you the power you need to understand your place in the world.