Harness the power of your data
Data-driven insights by using ibi™ WebFOCUS on the mainframe
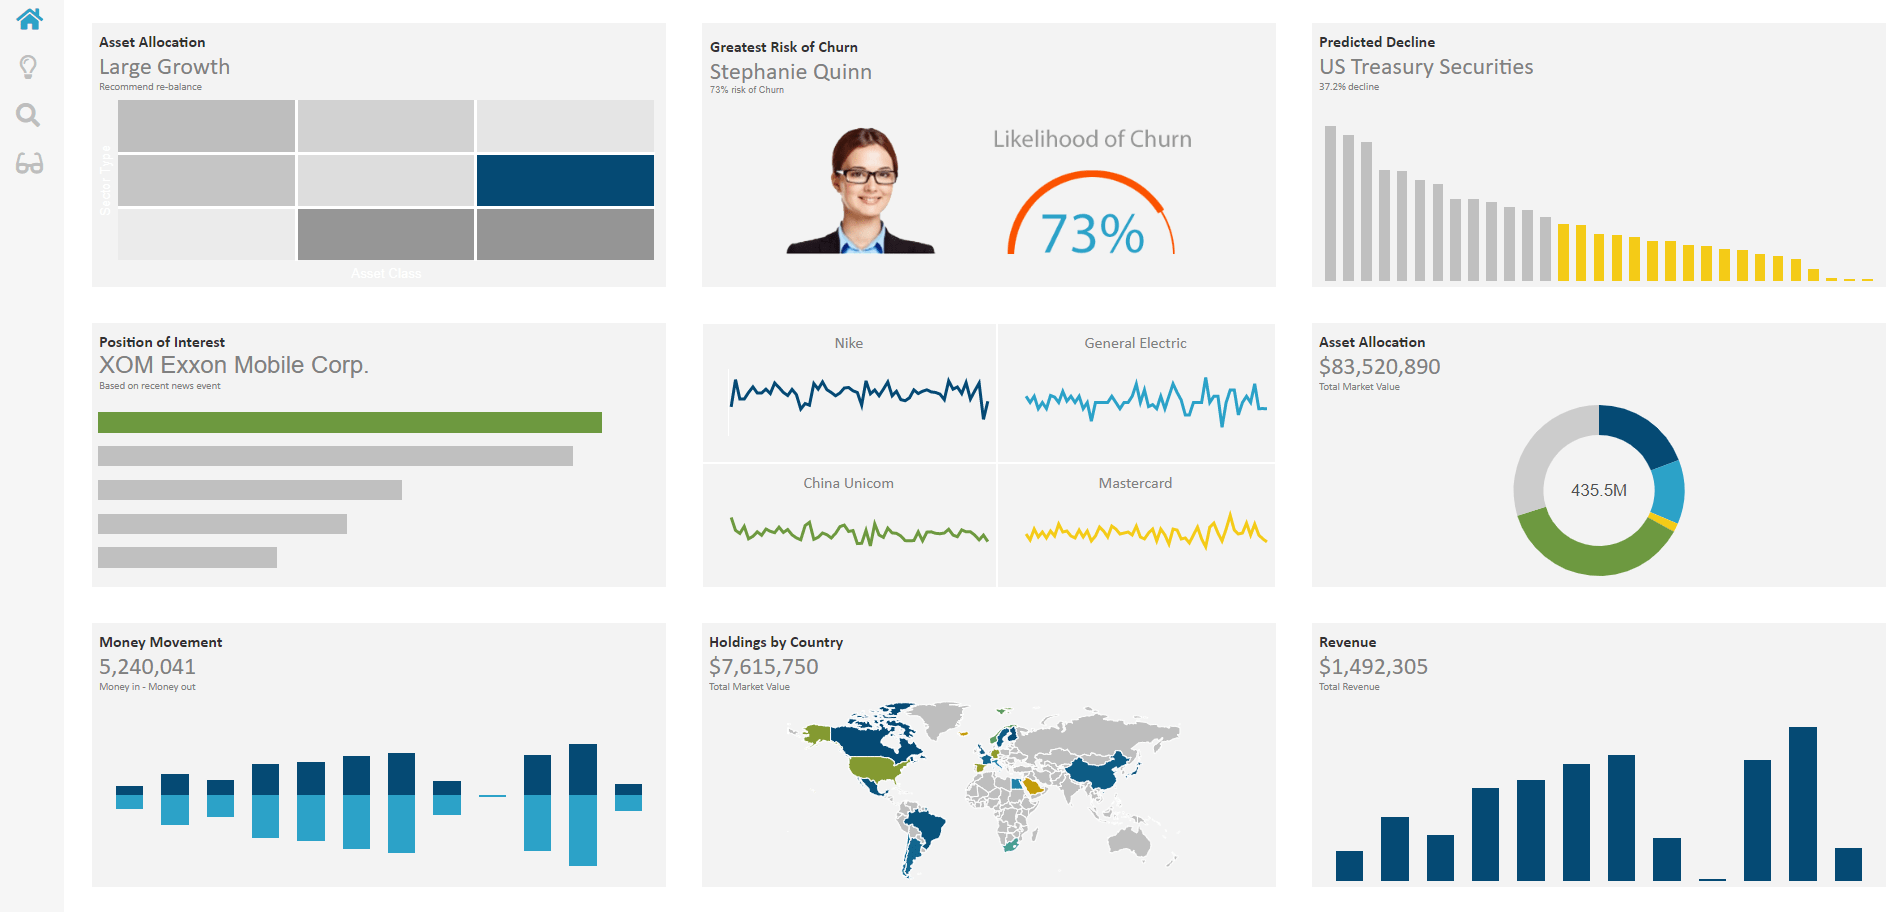
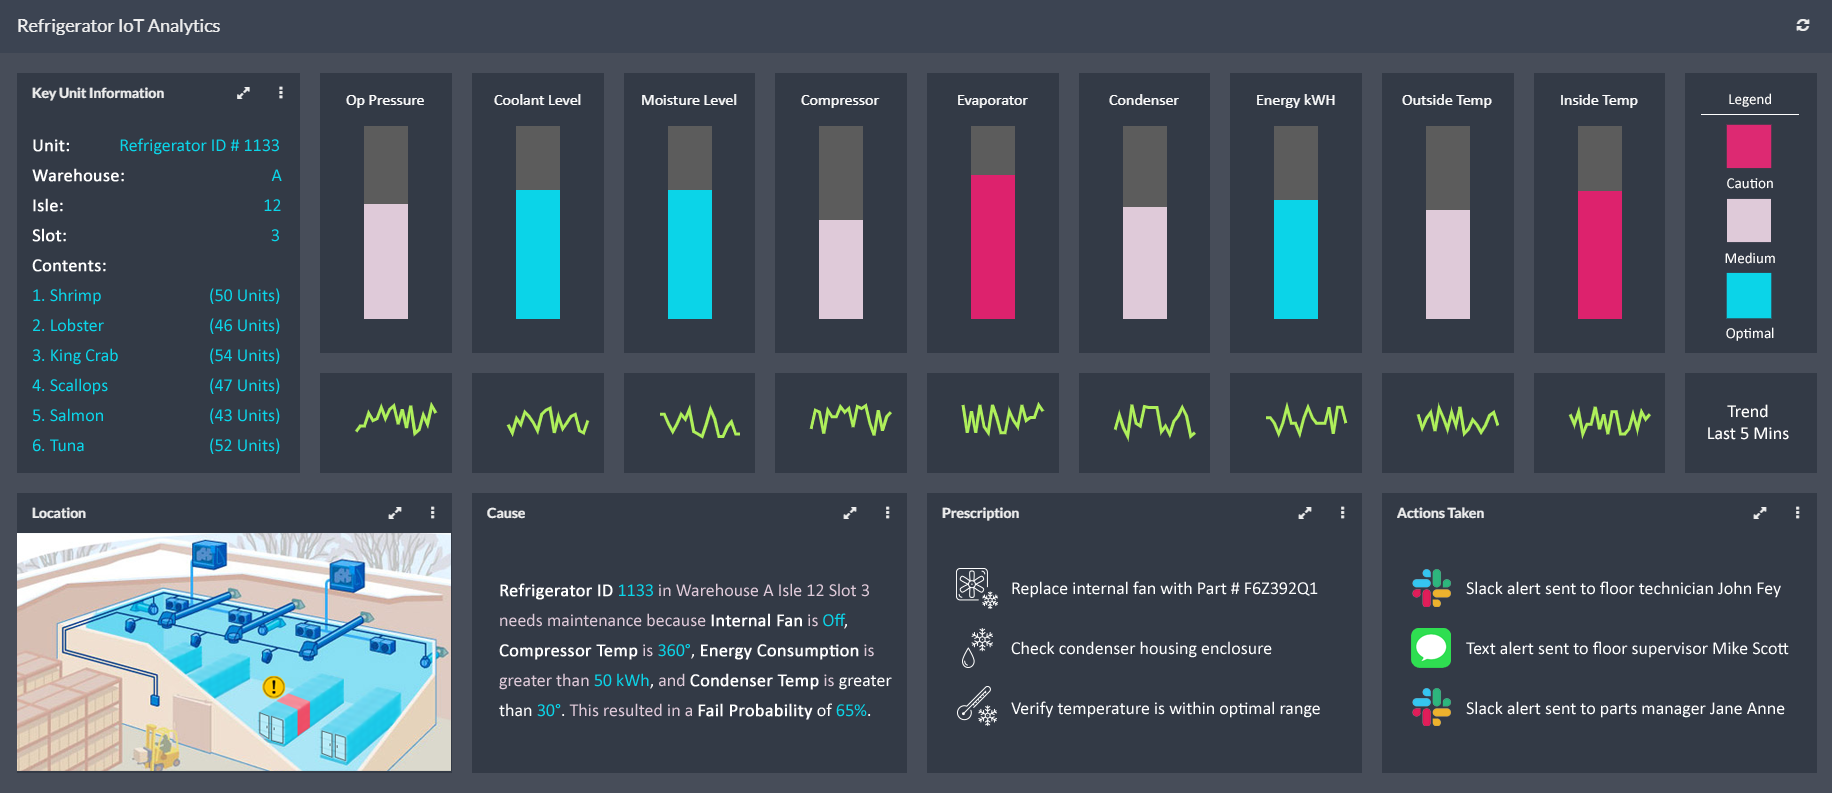
From dashboards to reporting to visualization, leverage your mainframe data directly in our premier analytics environment.
You are in good company
AutoZone shifts into high gear with ibi
WebFOCUS reveals operational metrics on demand, while also serving users in the field.
IT Director
AutoZone

Accelerate your move to WebFOCUS® 9.3
The WebFOCUS® Upgrade Program helps you and your organization use the platform's new capabilities by providing a smooth transition to this latest, feature-rich release.
A universal platform for all
Highly-scalable, self-service analytics
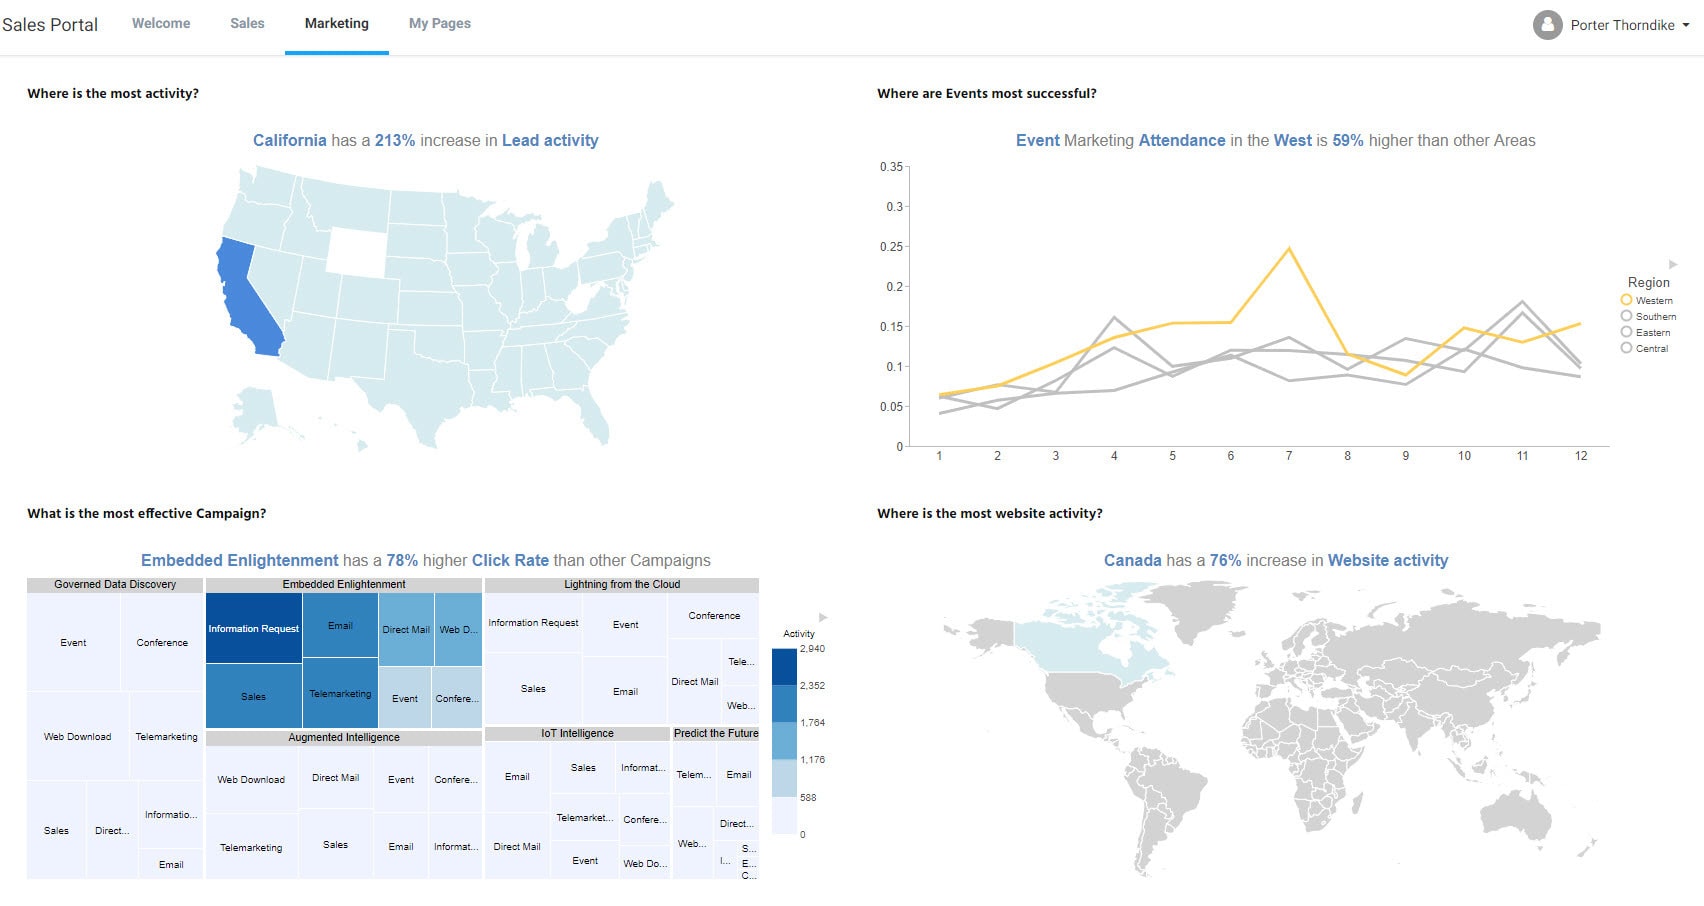
Explore, create, visualize, publish, and collaborate on your analytics content. Data scientists, developers, business analysts, and administrators can transform data and drive insightful decisions.

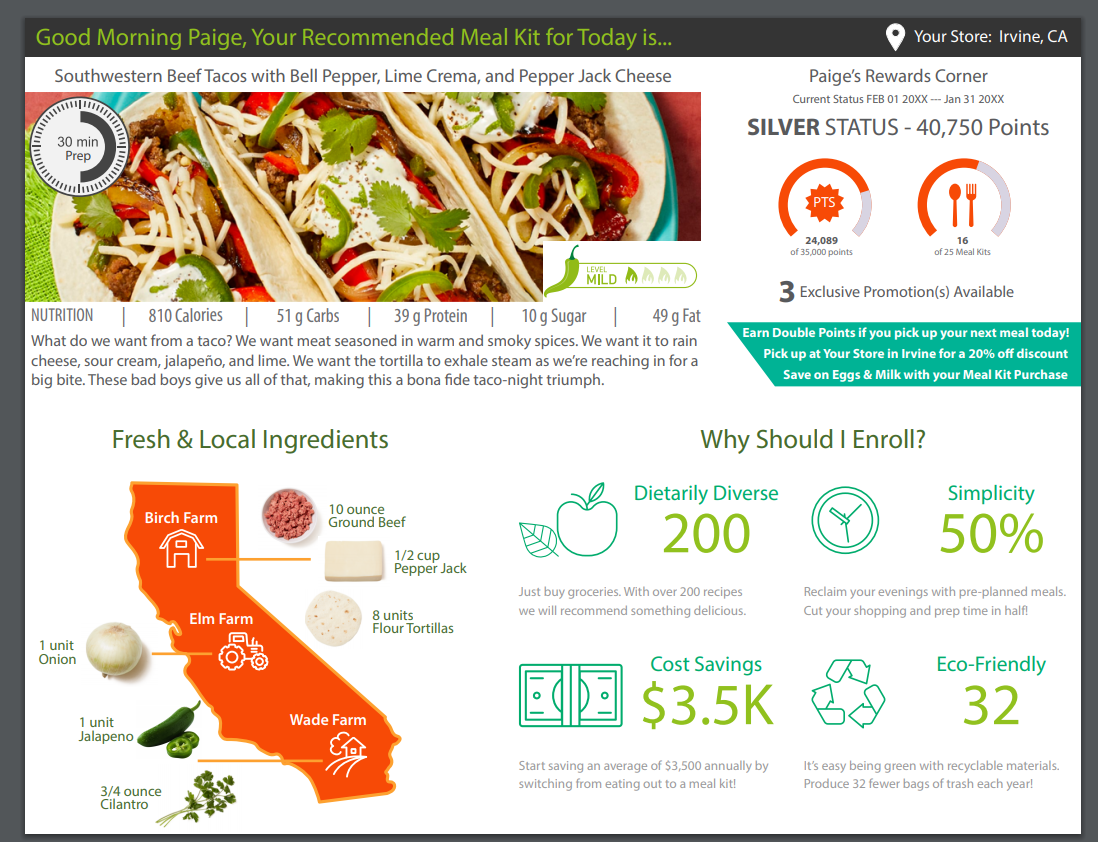
Pixel-perfect enterprise reporting and custom applications
High-precision reports for print-ready and paginated reporting needs. Create highly parameter-driven applications that mimic the ease of use and workflow of the most popular consumer applications.

Embedded analytics and white labeling
Embed any WebFOCUS component or self-service tool into any application with full support for security, rebranding, and white labeling.

Loosely coupled, tightly integrated
Easily connect with your existing data and analytics stack to tell the complete data story.

Key capabilities of WebFOCUS
-
![Thumbs up inside a blue circle icon]()
Embedded/OEM capabilities
Create and embed custom reports, analytic applications, and visualizations in web pages or apps. Apply resources to building the core application and use WebFOCUS software for the heavy lifting development of reports, apps, and visualizations.
-
![Location with street icon]()
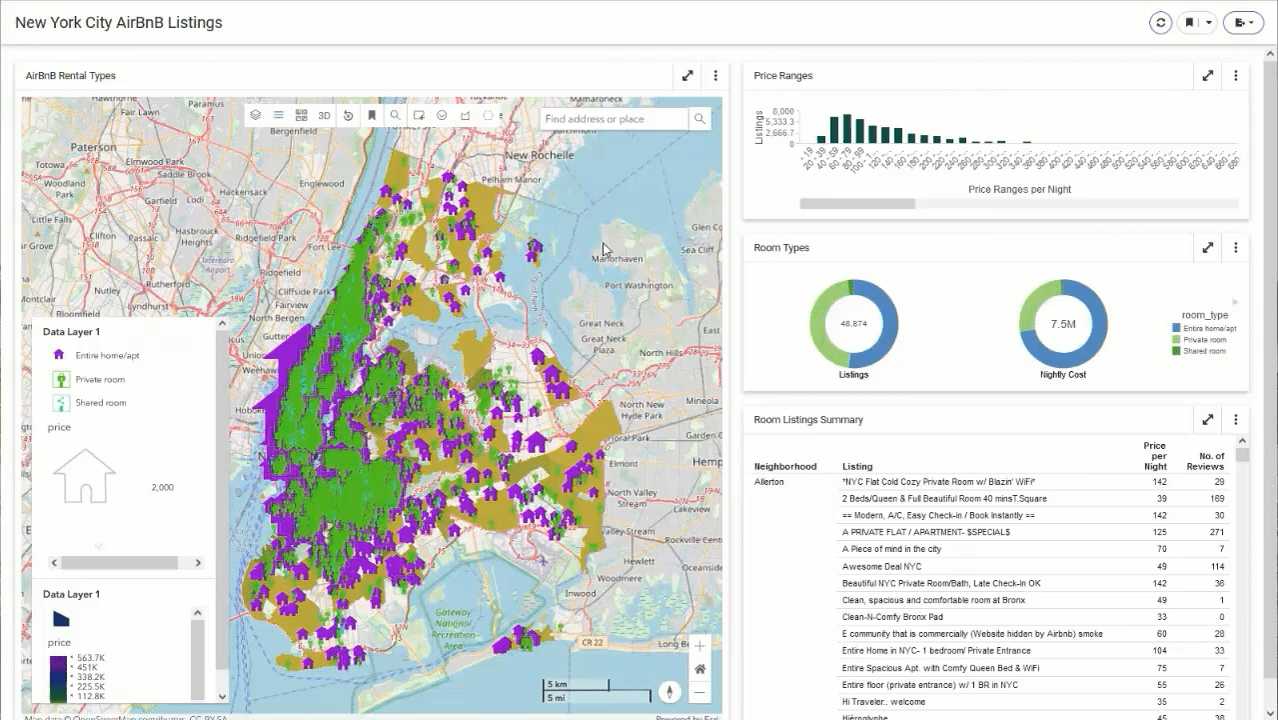
Location analytics
Combine geographic information (GIS) and BI/analytics to recognize patterns in data, and visualize and discover geospatial outliers. Teams make better business decisions through location analytics. Furthermore, with the addition of the creation of multilayer maps, users can now more easily explore and gain insights from content.
-
![Sheet with clock icon]()
ReportCaster
Schedule reports to run at specific times or intervals and distribute through the channel of choice in popular formats. Send an entire report or break it into sections using the ReportCaster burst feature for extreme granularity in what to share with whom.
-
![Globe with graph icon]()
Analytics anywhere
Empower end users with interactive reports and analytics, allowing them to share insights inside or outside of your organization. Whether they are online or offline, they can manipulate, visualize, and analyze secure, self-contained reports. WebFOCUS 9 adds filters and drill down capabilities, allowing users to further explore content on-demand, and on-the-go.
Get more information
WebFOCUS for mainframe is included in the ibi™ Mainframe Platform.
Like what you’re seeing?
Let’s continue the conversation. Learn more by contacting a WebFOCUS expert today.